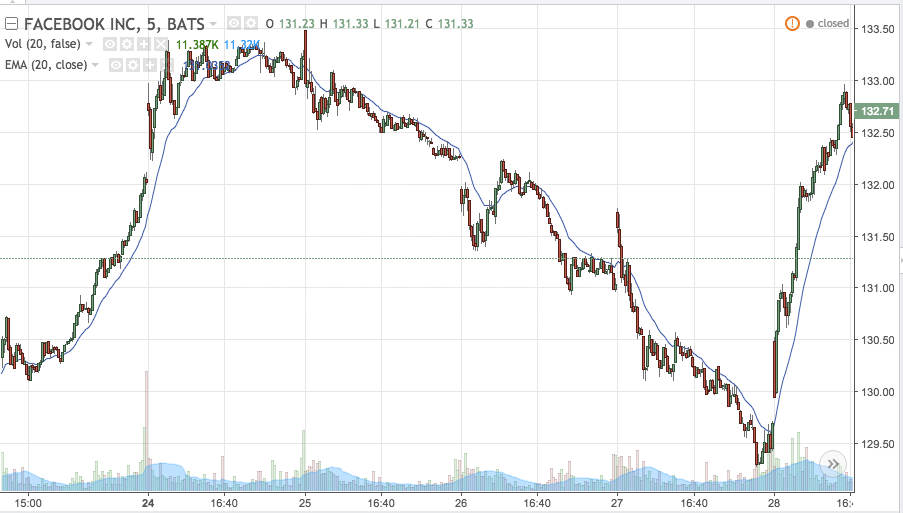
Intraday trading time analysis uses the charts as a major tool. Intraday charts display the price movements between the time frame of opening and closing. Getting acquainted with different charts and its uses is the best way for skilful time analysis.

Active traders often study charts to scan the future market trends. There are long term and short term intraday charts. But the most popular charts are those representing one-day interval fluctuations. Different charts are further explained in details.
Types of Intraday Trading Charts
There are mainly four types of intraday charts used for intraday trading time analysis.
-
Intraday Hourly Charts
Hourly charts are for short term types of trades or swing. These are to analyse the trades that last from hours to few days. Hourly intraday charts depict detailed data confined to a single trading day.
-
15 Minute Charts
15 minutes charts are for trades confining from an hour to few sessions of trading. They show movements at 15 minutes timeframe for any stock. The movements of high and low, closing, and opening are captured in 15 minute charts.
For Full Stock Market Training & Education Get Top 5 Nifty Trading Education in India
-
Intraday Five-Minute Charts
Five-minute intraday charts are the most popular charts used for time analysis. The charts are for quick trading from minutes to few hours. Long term traders also use five minute charts to determine the exit and entry points.
-
Two-Minute Charts
Yet another popular chart of intraday traders. The two minute chart shows price fluctuations of every 2 minute interval of a time period. Traders use them for trades of several minutes to some hours.
-
Intraday Tick Trade Charts
Tick charts are intraday trading charts for measuring transactions. Also, known as trade charts are in form of line charts and show each trade. Tick charts are simple to use and good to know strength and momentum.
0 thoughts on “Intraday Trading Time Analysis”